Paola Salmas, Vincent C. K Cheung. 2023. Gradient descent decomposition of force-field motor primitives optogenetically elicited for motor mapping of the murine lumbosacral spinal cord. Zoological Research, 44(3): 604-619. DOI: 10.24272/j.issn.2095-8137.2022.276
Citation:
Paola Salmas, Vincent C. K Cheung. 2023. Gradient descent decomposition of force-field motor primitives optogenetically elicited for motor mapping of the murine lumbosacral spinal cord. Zoological Research, 44(3): 604-619. DOI: 10.24272/j.issn.2095-8137.2022.276
Paola Salmas, Vincent C. K Cheung. 2023. Gradient descent decomposition of force-field motor primitives optogenetically elicited for motor mapping of the murine lumbosacral spinal cord. Zoological Research, 44(3): 604-619. DOI: 10.24272/j.issn.2095-8137.2022.276
Citation:
Paola Salmas, Vincent C. K Cheung. 2023. Gradient descent decomposition of force-field motor primitives optogenetically elicited for motor mapping of the murine lumbosacral spinal cord. Zoological Research, 44(3): 604-619. DOI: 10.24272/j.issn.2095-8137.2022.276
School of Biomedical Sciences, and Gerald Choa Neuroscience Institute, The Chinese University of Hong Kong, Hong Kong SAR, China
2.
Kunming Institute of Zoology - The Chinese University of Hong Kong (KIZ-CUHK) Joint Laboratory of Bioresources and Molecular Research of Common Diseases, Hong Kong SAR, China
Funds: This work was supported by the CUHK Faculty of Medicine Faculty Innovation Award FIA2016/A/04 (to V.C.K.C.), Group Research Scheme NL/JW/rc/grs1819/0426/19hc (to V.C.K.C.), and The Hong Kong Research Grants Council 24115318, CUHK-R4022-18, 14114721, and 14119022 (to V.C.K.C)
Generating diverse motor behaviors critical for survival is a challenge that confronts the central nervous system (CNS) of all animals. During movement execution, the CNS performs complex calculations to control a large number of neuromusculoskeletal elements. The theory of modular motor control proposes that spinal interneurons are organized in discrete modules that can be linearly combined to generate a variety of behavioral patterns. These modules have been previously represented as stimulus-evoked force fields (FFs) comprising isometric limb-endpoint forces across workspace locations. Here, we ask whether FFs elicited by different stimulations indeed represent the most elementary units of motor control or are themselves the combination of a limited number of even more fundamental motor modules. To probe for potentially more elementary modules, we optogenetically stimulated the lumbosacral spinal cord of intact and spinalized Thy1-ChR2 transgenic mice (n=21), eliciting FFs from as many single stimulation loci as possible (20–70 loci per mouse) at minimally necessary power. We found that the resulting varieties of FFs defied simple categorization with just a few clusters. We used gradient descent to further decompose the FFs into their underlying basic force fields (BFFs), whose linear combination explained FF variability. Across mice, we identified 4–5 BFFs with partially localizable but overlapping representations along the spinal cord. The BFFs were structured and topographically distributed in such a way that a rostral-to-caudal traveling wave of activity across the lumbosacral spinal cord may generate a swing-to-stance gait cycle. These BFFs may represent more rudimentary submodules that can be flexibly merged to produce a library of motor modules for building different motor behaviors.
A principal function of the central nervous system (CNS) is to coordinate musculature so that motor behaviors critical for survival can be quickly, flexibly, and suitably generated in a context-dependent manner. Given the huge number of neuromusculoskeletal elements – including tens of thousands of motor units within hundreds of skeletal muscles – to control in every behavioral task, performing any movement requires the CNS to perform complex calculations to generate the desired movement trajectories. To maintain behavioral diversity while ensuring rapid and accurate selection of motor commands, the CNS is proposed to group multiple muscles together through neuronal networks in the spinal gray matter and control them as individual motor modules, which are then selected, combined, and activated to generate the required movement (Bizzi & Cheung, 2013; Cheung & Seki, 2021). These motor modules simplify motor control computations, thereby allowing the production of diverse behaviors through the specification of a relatively small number of degrees of freedom.
Previous studies investigating the motor module hypothesis have represented motor modules as stimulus-evoked isometric force fields defined across different locations of the limb workspace. Electrical microstimulation studies in spinalized bullfrogs (Bizzi et al., 1991; Giszter et al., 1993; Mussa-Ivaldi et al., 1994), rats (Tresch & Bizzi, 1999) and monkeys (Yaron et al., 2020) have shown that spinal premotor interneurons are themselves organized into modules that activate specific sets of muscles, and each muscle can be activated by multiple modules that can be linearly combined. Electrical microstimulation, however, does not permit detailed dissection of the types of spinal neurons that are assembled to form the motor modules. Using other stimulation techniques, subsequent studies have attempted to identify, with greater specificity, the neuronal types involved in structuring motor modules (Caggiano et al., 2016; Levine et al., 2014; Saltiel et al., 2001). Caggiano et al. (2016) optogenetically stimulated different types of neurons in two intact transgenic mouse strains expressing light-sensitive channelrhodopsin-2 (ChR2) in motoneurons (Chat-ChR2 strain) and putative excitatory neurons (Thy1-ChR2 strain), respectively. Highlighting the different contributions of the two types of neurons to light-elicited force fields, these authors reasonably concluded that motor modules originate from excitatory spinal premotor interneurons.
The abovementioned studies describe the existence of spinal modules as the basis of motor behaviors. Nevertheless, it remains to be clarified whether any force fields derived by stimulating a particular spinal locus are indeed produced from the activation of a single discrete, modular spinal premotor network, or by the combined activation of several more fundamental modules whose representations are distributed across the spinal cord. For instance, when the spinal premotor networks of two separate modules intermingle at a particular locus, stimulation at that locus would likely recruit both modules simultaneously. Here, we explored the possible existence of more fundamental force-field motor primitives and studied their properties by applying machine learning techniques to analyze the variability of the experimental force fields.
Machine learning has been widely used in neuroscience and cognitive science in the last decade (Savage, 2019; Vogt, 2018). Algorithms ranging from those used to analyze neuronal temporal dynamics to those employed in robotic arm control have shed light on the computational mechanisms of the CNS. In motor neuroscience, algorithms such as the non-negative matrix factorization (Lee & Seung, 1999) have been used to identify muscle synergies underlying movements from multi-muscle electromyographic data (Cheung et al., 2005, 2020; Clark et al., 2010; Devarajan & Cheung, 2014; Sylos-Labini et al., 2020; Tresch et al., 1999). In this work, we employed a machine learning method to assess whether the force field variability could be accounted for by a small number of invariant basic force fields – structures that may be interpreted as rudimentary motor primitives. Indeed, previous studies have suggested that motor modules encoded in the CNS may have significantly overlapping topographical representations (Overduin et al., 2012; Rathelot & Strick, 2006; Saltiel et al., 2005). We thus hypothesized that stimulation-derived force fields may themselves be the result of a combination of even more elemental modules.
To test this hypothesis, we followed Caggiano et al. (2016) to optogenetically stimulate the spinal cord of Thy1-ChR2 mice to elicit motor modules represented as spatial fields of isometric ankle forces. To address our questions, however, we differed from the above study in multiple ways. First, in each animal, we extensively stimulated the lumbosacral cord to elicit as many force field varieties as possible by moving the laser along the spinal cord in finer steps than Caggiano et al. (2016), and used a gradient descent algorithm to extract the basic force fields underlying the observed force fields, rather than relying on standard clustering alone. We also characterized the relationship between the structures and topographical distributions of the basic force fields along the spinal cord by analyzing how the extracted basic force fields alter their contribution to the construction of the observed force fields across spinal loci. Second, we applied both minimally necessary and higher laser intensity stimulations to assess the robustness of the basic force fields instead of relying on a single intensity as in the earlier study. Lastly, while Caggiano et al. (2016) used intact mice in their stimulations, we used both intact and spinalized preparations to assess the potential involvement of supraspinal centers in basic force field organization. Overall, our work extends previous results and argues that a small number of hindlimb motor primitives representable as force fields are encoded in the lumbosacral spinal cord.
MATERIALS AND METHODS
Animal preparation and surgery
In this study, we used 21 Thy1-ChR2 transgenic mice (15 males, six females, 20–30 g; Thy1-COP4/EYFP; The Jackson Laboratory) expressing ChR2 in putative excitatory neurons (Caggiano et al., 2016). We aimed to stimulate the excitatory premotor interneurons located in the intermediate gray matter and ventral horn of the spinal cord, as described in previous study (Levine et al., 2014). Caggiano et al. (2016) used the same transgenic strain to assess the same population of excitatory premotor interneurons to understand how motor modules are underpinned by neural circuits.
Each mouse was first anesthetized with isoflurane (1.5%–2.0%; mixed with 0.8 L/min oxygen), then with an intraperitoneal injection of a ketamine/xylazine cocktail (100 mg/kg and 10 mg/kg, respectively). To expose the lumbosacral vertebrae, the back skin was shaved and cleaned with ethanol (70%), after which a longitudinal skin incision was made above the spine and back muscles and their tendons were resected. Once the exposed vertebral laminae were cleared of muscles, the vertebrae were secured and fixed in a stereotaxic apparatus with two clamps. Using surgical scissors, laminectomy was performed on the thoracic vertebral segments T11, T12, and T13, whose vertebral foramina house the lumbosacral spinal cord (Harrison et al., 2013).
To anatomically separate the lumbosacral spinal network from the supraspinal areas in the brain, we performed spinalization on two animals, following a procedure similar to that of Liu et al. (2010). While the animal was under anesthesia, prior to laminectomy of T11–T13, thoracic vertebrae at the T8 level were exposed and laminectomy was performed. Surgical iridectomy scissors were used to transect the spinal cord.
To ensure that the animal remained under deep anesthesia during the experiment, a control check was conducted every 20 min by pinching the tail and foot with a pair of tweezers and by checking the blink reflex. If the animal exhibited any of the aforementioned responses, an additional dose of anesthetic (half of the first dose) was delivered, with a 15–20 min break taken before continuing.
All surgical procedures and experiments were performed under anesthesia and approved by the Animal Experimentation Ethics Committee of The Chinese University of Hong Kong (CUHK) (protocol 16-023-MIS and 20-282-MIS) before experimentation. All animal care was provided in accordance with CUHK guidelines.
Optogenetic mapping and isometric force recording
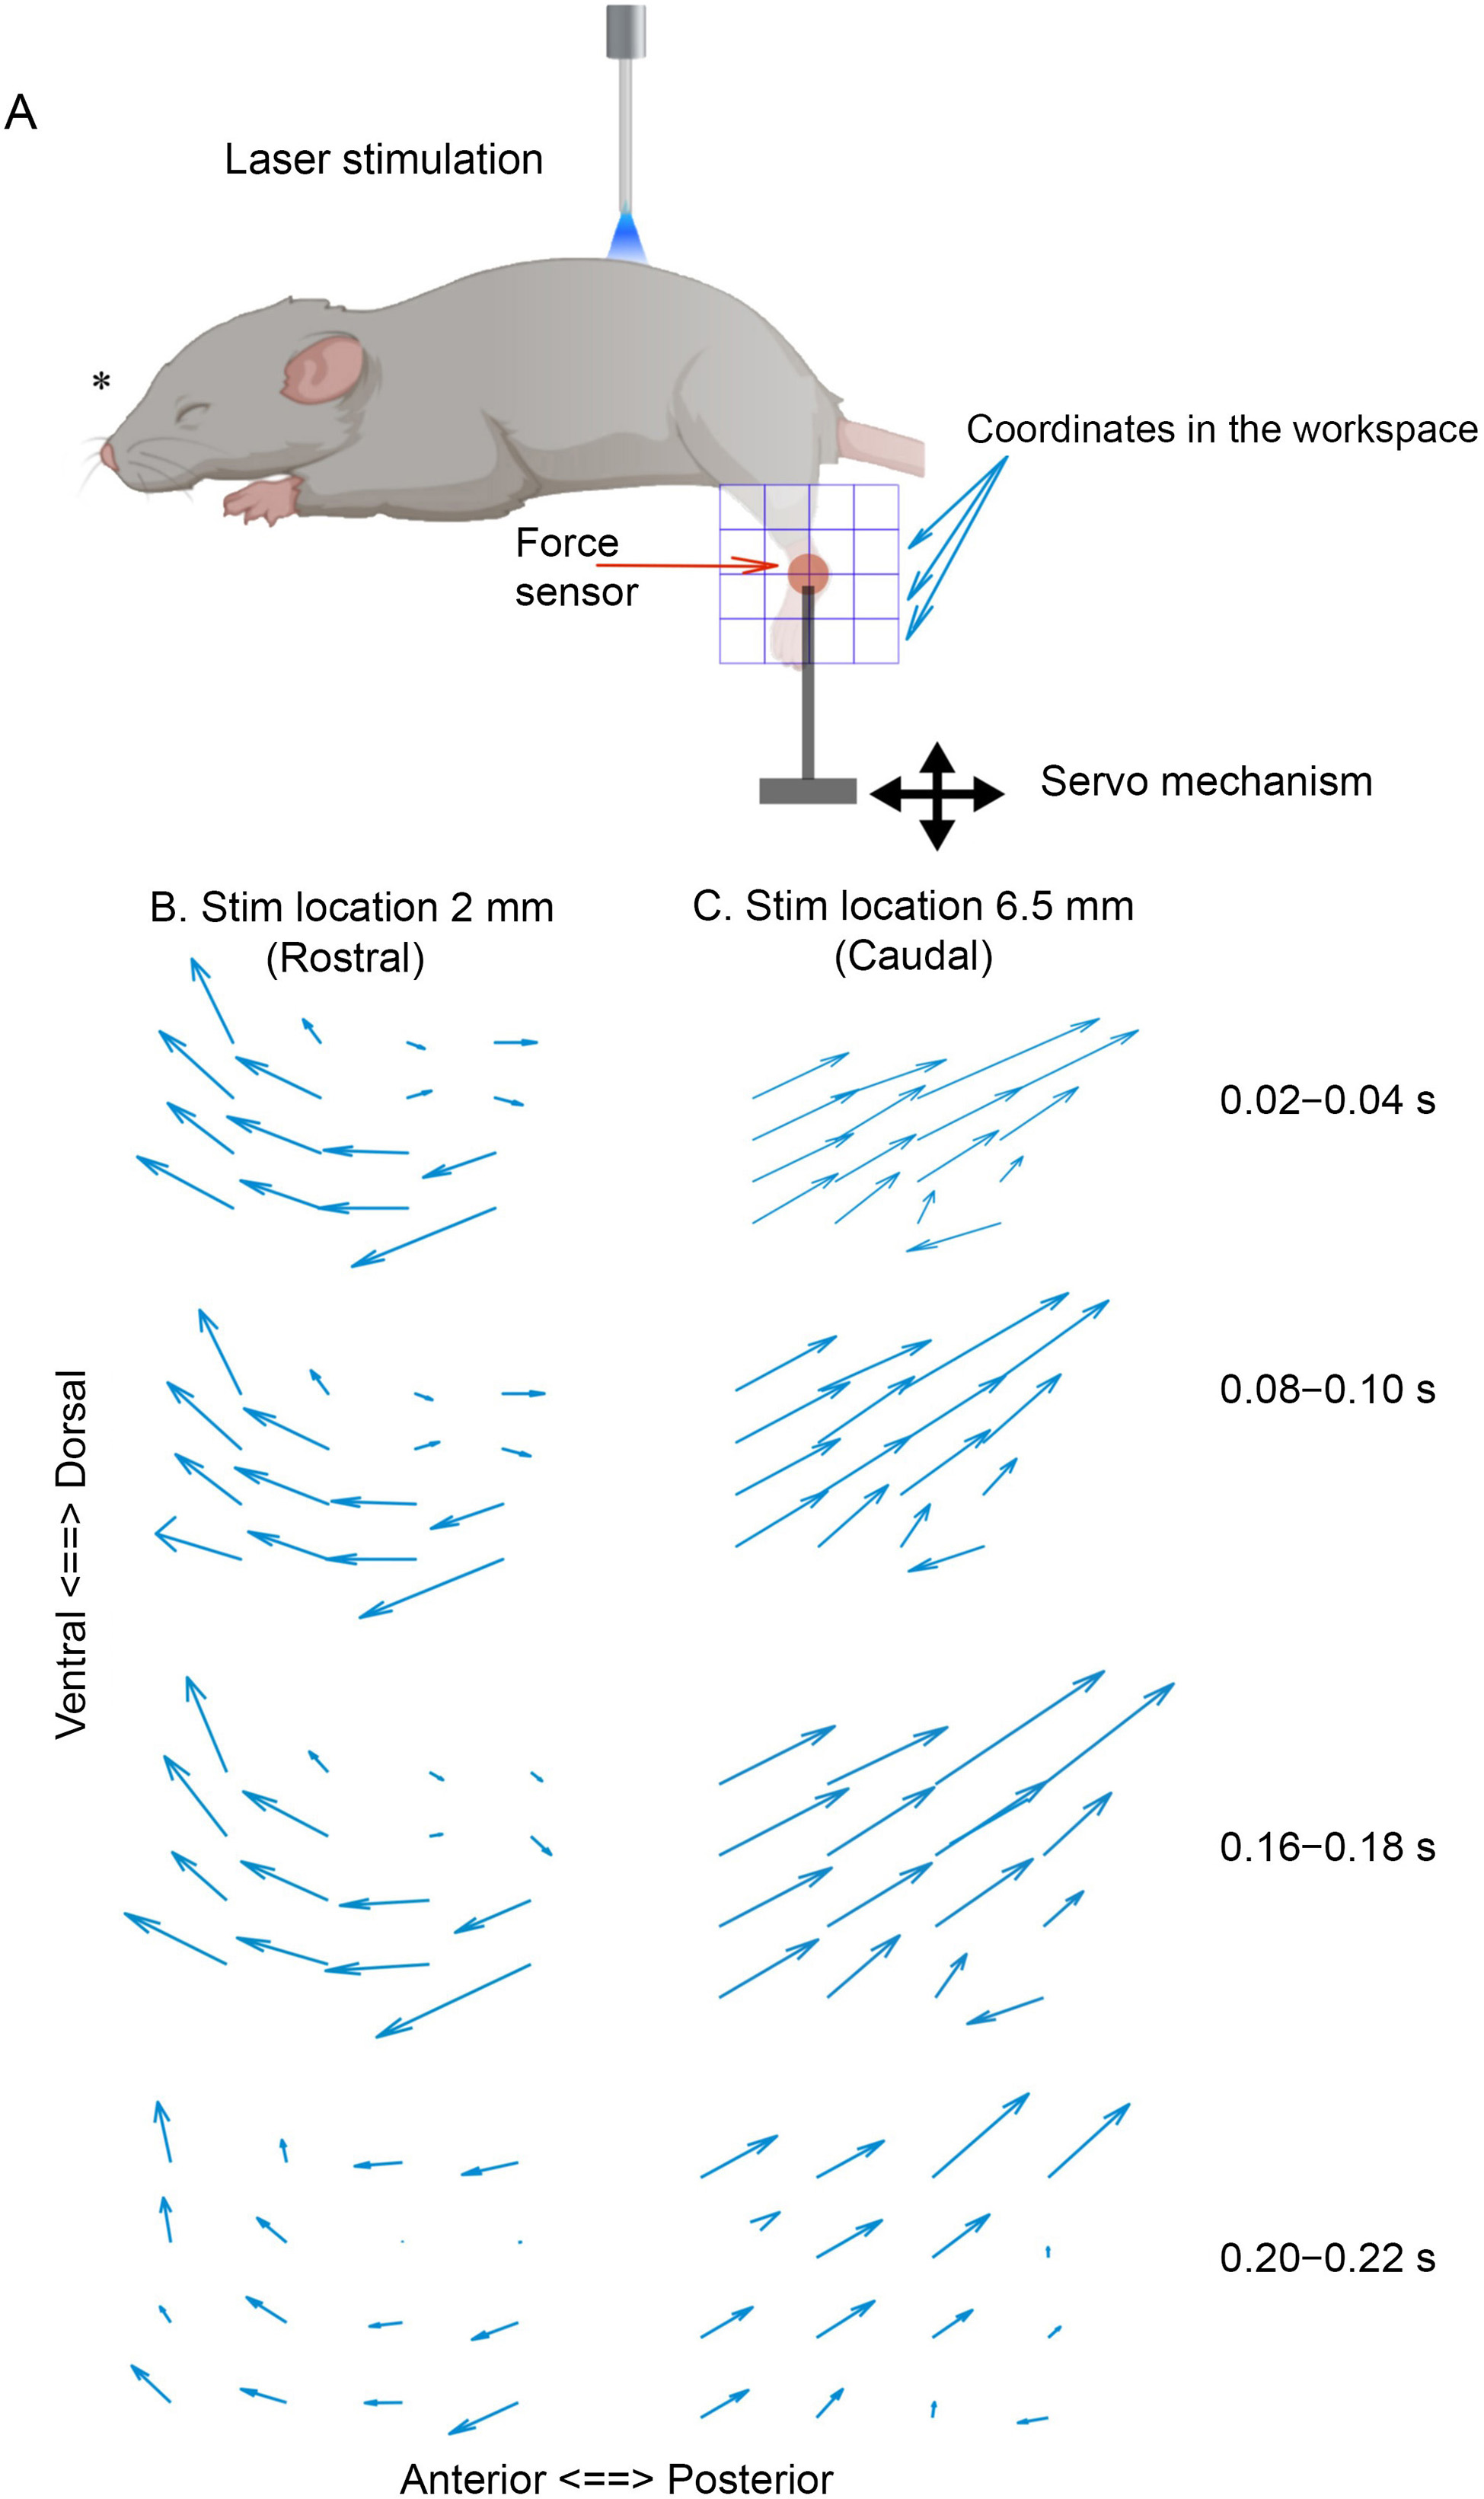
To measure the isometric force field (FF) of the hindlimb elicited by optical stimulation, the ankle of each anesthetized mouse was fixed to a six-axis force transducer (F/T sensor nano17, 100 kHz; ATI Industrial Automation, Apex, NC, USA) mounted on a two-servo positioning device (model T-LSM100; Zaber Technologies, Vancouver, BC, Canada). This device allowed us to define the extent of the hindlimb workspace in a two-dimensional (2D) vertical plane, and to fix the ankle at any position within it during each stimulation trial (Figure 1A). To obtain the FF, we divided the workspace into a 4×4 grid with 16 equally spaced locations and used customized Matlab scripts to control the servo device so that at each spinal stimulation locus, the ankle was sequentially fixed at these 16 locations in a randomized order. Thus, each spinal stimulation locus comprised 16 stimulation trials, with one trial performed every 10 s. For each trial, the ankle was fixed at a different location. As a result, trials for one spinal locus were completed every 3 min.
Figure
1.
Visual examination of raw FFs
A: shows a schematic representation of experimental setup. B, C: show examples of raw FFs of one mouse elicited by a laser beam positioned at T11 (rostral) and T13 (caudal), respectively. FFs elicited at 20, 80, 160, and 200 ms from stimulation onset are shown. FFs elicited at the most rostral and caudal parts of the spinal cord comprise anterodorsally and posterodorsally directed force vectors, respectively. *: Created in Biorender.
We optogenetically stimulated the spinal cord using a diode-pumped solid-state (DPSS) blue laser (473 nm; maximum power of 200 mW; Shanghai Laser and Optics Century, Shanghai, China) coupled to a 200 μm core optical fiber. The optical fiber was positioned immediately above the spinal cord with its tip just touching the spinal surface, ipsilateral to the side of force recording and approximately 300 μm lateral to the midline. With the laser at this location, we best accessed the premotor interneurons that coordinate the motoneuronal pools of the different hindlimb muscles (Caggiano et al., 2016; Levine et al., 2014). At the beginning of each experimental session and before recording the FFs, we first established the minimum laser power threshold required to elicit an observable force response in each animal by positioning the laser approximatively midway between the rostral and caudal ends of the exposed spinal cord (Caggiano et al., 2016). Across animals, the average threshold was 35.6%±26.4% (mean±standard deviation (SD)) (range 23%–100%, 100% in two mice) of maximum laser intensity. Of note, the absolute laser power values at threshold were higher than those reported in Caggiano et al. (2016). We defined threshold as the minimum power needed to elicit an isometric muscle contraction, following Caggiano et al. (2016). The difference in threshold power may be due to the lack of stability of DPSS lasers, whose crystals can lose efficiency with time, leading to some power loss when the initial beam frequency is converted to obtain the desired wavelength, thus requiring more power to deliver the same photocurrent. In addition, power requirements may vary between animals due to varying degrees of opsin expression in different colonies (Mattis et al., 2012). Thus, in each experimental session, we considered both individual differences in animals and potential long-term fluctuations in laser performance over time by systematically controlling laser power to ensure that correct stimulation intensities were delivered to each mouse for the threshold and above-threshold trials.
FFs along the entire length of the exposed ipsilateral lumbosacral cord were elicited by successive rostral-to-caudal repositioning of the laser in 100 µm increments. At all loci, the stimulation pulses were kept at threshold power with a duration of 200 ms, frequency of 100 Hz, and pulse width of 5 ms. By maintaining stimulation at threshold, we recruited neurons in the smallest possible delimited volume in the spinal cord, allowing better assessment of how FF topography may reflect the spatial distribution of the spinal neuronal networks that organize motor modules. A total of 646 spinal loci were stimulated across 21 mice, with a range of 20–70 loci per mouse (average of 36±21), a much finer map than that in Caggiano et al. (2016).
To further investigate the effect of increased power on the FFs, we stimulated some spinal loci of a subset of mice (n=13) at above-threshold power. Within this subset, we systematically increased the stimulation intensity of 28 loci in six mice in steps of 1.5% (of maximum laser intensity) for three or four steps, with stimulation duration set at 500 ms. For these trials, stimulation intensity was manually controlled from the laser generator, while onset time, frequency, pulse width, and duration of stimulation were controlled by data acquisition software (Synapse Suite v92; Tucker-Davis Technologies, Alachua, FL, USA) and customized Matlab scripts.
In our experiment, the vertebrae were securely fixed between two clamp holders, and the elicited isometric muscle contractions did not provoke any change in position of the back or spine, even when higher stimulations were delivered. Nevertheless, to exclude the possibility that the optical fiber induced mechanical stimulation of the spinal cord during high-intensity trials due to artefactual movement of the cord, thus altering the cord state, we performed control experiments. In a subset of four animals, we controlled the position of the fiber by positioning it at two different heights above the spinal cord: i.e., slightly touching (as in all other animals) and 50 µm above, with stimulation at both threshold and high intensities.
Construction of force fields
Before proceeding with force-field analysis, a low-pass Butterworth filter (cutoff of 20 Hz) was applied to the raw time-series force data to remove electrical noise detected by the acquisition system. In electrophysiological experimental settings, unwanted electromagnetic interference on the signal derived from spontaneous fluctuations in current and voltage detected by high-sensitivity electrical circuits can mask physiologically meaningful signals. It is common practice to apply digital filters to remove noise from raw signals to ensure downstream analysis is not obscured by physiologically irrelevant signals. After filtering, further analyses were performed on the preprocessed data of all animals.
In each trial, the onset time of force generation was detected as follows. The magnitude of absolute force evoked was first calculated from the anteroposterior and dorsoventral components of the force, as measured by the force transducer. Then, for each mouse, we extracted from the continuous raw signal the 16 stimulation trials for each spinal stimulation locus. The active force for each ankle location was then calculated by subtracting the baseline force, defined as the average force during the 200 ms preceding stimulation onset, from the force recorded during the trial. The active force at each ankle location was then normalized to the highest magnitude of active force attained at that location in the experiment, and then time-averaged over 20 ms bins for further analysis. Lastly, for each mouse, we created a data matrix in which the x- and y- spatial coordinates of the 16 vectors of each field (totaling 16×2=32 components) were rearranged into a single 32 tuple vector, each denoting the component average over a time step of 20 ms. Thus, each column of the resulting matrix represented the force coordinates of a single time step. These matrices for different mice were used for all subsequent analyses.
To spatially represent the active force pattern as a time-invariant field, considering inter-mouse variability in workspace dimensions, the 4×4 grid of ankle locations was normalized to a square with unit lengths. The force vectors across workspace locations were then depicted as a quiver plot in Matlab. The force vectors were not spatially interpolated, as in some earlier studies (e.g., Bizzi et al., 1991; Caggiano et al., 2016).
Variability of force fields
We studied invariant structures embedded within the variability of the observed FFs. Specifically, we considered variability across spinal stimulation locations, across time during stimulation trials, and across animals.
Spatial force field variability: To verify whether the FFs elicited by stimulation represent basic motor modules, we examined whether multiple FFs share similar features and can therefore be categorized as a group. We also investigated whether regularities exist in the diverse FFs elicited from different spinal stimulation loci and whether they can be consolidated into a few force-field types. To achieve this characterization, we applied a mathematical clustering procedure, k-means clustering, so that the extracted FF clusters represented the different categories of FFs identified; thus, FFs belonging to the same cluster would share the same features. For each spinal locus, we selected the FF elicited at threshold power observed between 100 and 120 ms from stimulation onset. Using the FFs at the same time points within the stimulation trials, we excluded the effects of any potential temporal changes in FFs within each trial (see below). We then clustered all FFs from each mouse using the k-means algorithm (kmeans in the Statistics Toolbox of Matlab; 500 repetitions), implemented in 32 dimensional space defined by the x- and y-components of the 16 force vectors. The number of FF clusters was set to the number yielding the maximum average silhouette value, found using the Evacluster tool and silhouette function in Matlab. The extent to which each cluster centroid reconstructed the FFs within the cluster was quantified by adjusted R2.
Temporal force field variability: To evaluate the variability of FFs across time within the stimulation trials, we examined how the vector direction evolved in each trial for each of the 16 vectors across workspace. For each mouse, we considered each spinal stimulation locus separately, and determined the differences in vector angles between successive 20 ms time steps. Specifically, at each time point, if x and y are the anteroposterior and dorsoventral components of a force vector, respectively, then:
αt=arctanyx
(1)
where αt is the vector angle at time t, and
Δαt=αt+Δt−αt,0⩽
(2)
where \Delta t =20 ms. For each spinal stimulation locus, the change in angle was calculated for 30 time bins from stimulation onset (i.e., 30×20=600 ms) and averaged across the 16 ankle locations for each time bin.
Inter-mouse force field variability: To characterize FF variability across mice, we clustered all FFs collected from all mice using k-means, obtaining six clusters. We then calculated the adjusted R2 values of the clusters as described above. We also examined whether any clusters contained fields from only a small subset of mice. For group analysis, before clustering, the magnitudes of the force vectors of all fields were normalized against the maximum vector magnitude observed among all FFs.
Extraction of basic force fields
The spatiotemporal variability of FFs described above allowed us to highlight their differences across different spinal stimulation loci, different time bins within trials, and different animals. We then asked whether there were regularities embedded within the variability of the FFs that could remain invariant across stimulation location and time. If present, they could represent the basic structures that underpin the observed FFs. We investigated the possibility to extract, from the observed FFs, these more fundamental FFs whose combination may explain the fields from different spinal loci at different times. Let \overrightarrow{FF}(x,y,t,s) be an observed FF whose force vectors depend on ankle location (x and y), stimulation time (t), and spinal stimulation locus (s), such that we modelled the FFs as follows:
where \overrightarrow{{BFF}_{k}} is the kth basic force field (BFF) as a function of ankle location, M is the number of BFFs underpinning the FF data, and ck is a time- and spinal locus-dependent coefficient that activates the kth BFF. In matrix notation,
FF\approx BFF\cdot C,BFF,C\in \mathbb{R}
(4)
To extract BFF and C from FF, we employed the gradient descent method. We derived the following update rules to find the estimates that minimize the squared error of FF reconstruction:
where η is a positive learning rate, set as max(| FF |)/β, with β=3 000. Every extraction was repeated 50 times, with different random initializations of BFF and C in each repetition, and was terminated when {R}_{i+1}^{2}- {R}_{i}^{2} was smaller than 0.0001 for 30 consecutive iterations. The repetition with the highest {R}^{2} was then selected for further downstream analysis.
Since the above algorithm requires the number of BFFs to be specified a priori, to identify the optimal number of BFFs, we first ran the algorithm with the number of BFFs increased successively from 2 to 10. We selected the number of BFFs that showed an FF reconstruction R2>70%, and at which point the patterns of the force vectors for the extracted BFFs differed from each other.
Basic force field similarity: To compare the BFFs under different conditions, we calculated their cosine similarity (CosSim), defined as the cosine of the angle between the two fields and calculated as the inner product of the two fields divided by the norms of the fields. Therefore,
After extracting the BFFs, we investigated whether their activations along the length of the spinal cord exhibited any topographical organization. For each BFF, we plotted its coefficients (C in equation (4); 100–120 ms from stimulation onset; normalized to the maximum coefficient value for that BFF observed in each mouse) along the cord as a heatmap. We then verified whether the topographical distributions of BFF activations along the spinal cord were consistent across animals. To find homologous BFFs among different mice, we grouped the BFFs into clusters using k-means. For the BFFs from different mice falling within the same cluster, since the exact stimulation locations differed slightly between animals, their coefficients at fixed anteroposterior spinal stimulation locations were found by interpolation, then averaged across animals.
Force field convergence and conservativity
Force field convergence: Multiple studies of spinal motor primitives have identified FFs with force vectors that tend to converge at equilibrium points within the workspace (Bizzi et al., 1991, 1995; Giszter et al., 1993; Mussa-Ivaldi & Giszter, 1992; Mussa-Ivaldi et al., 1994) or on the boundaries of the workspace (Caggiano et al., 2016; Lemay et al., 2002). Similar to the equilibrium point posited by the equilibrium point hypothesis of motor control (Bizzi et al., 1992; Feldman, 1986), the FF equilibrium point represents the final postural position of the limb end point after the FF is individually recruited. The limb end point shifts towards the equilibrium point with a trajectory dictated by the directions of the FF force vectors; at the equilibrium point, the limb stops moving because rotational forces from the antagonistic muscles balance each other. The position of the FF equilibrium point depends on the motor commands and intrinsic viscoelastic properties of the muscles.
Inspired by these prior works, we quantified the degree of vector convergence (or equivalently, divergence) of the FFs and BFFs as a property of the field. In vector calculus, the divergence of a vector field, as a scalar, indicates the amount of flux expansion at a given location within the field. For vector field F(x,y)=P(x,y)i→+Q(x,y)j→,divergence (div F) is defined by:
div F= \frac{\partial P}{\partial x} + \frac{\partial Q}{\partial y} .
(7)
To determine div F, we used the divergence function in Matlab. The resulting divergence (4×4 matrix) reflects the extent of divergence of the force vectors at the 16 ankle locations in the workspace, with positive values indicating divergence and negative values indicating convergence. We defined FFs as divergent if the sign of their average div F across all ankle locations was positive, and convergent if negative.
For each mouse, we calculated div F for both FFs and BFFs. For FFs, field-averaged div F values were regressed against stimulation parameters, including power intensity and anteroposterior coordinates of the spinal stimulation location. To depict the relationship between BFF div F and topography, for each BFF cluster and at each spinal stimulation location, we calculated average div F, but with values weighted by the BFF coefficients at that spinal location.
Force field conservativity: Previous studies have assumed that non-conservative patterns in the FF structure may reflect complex feedback interactions (e.g., those from postural feedback) (Giszter & Kargo, 2000; Mussa-Ivaldi, 1992). To verify this possibility, we studied the conservativity of the average FFs of each spinal location for each mouse, following the basis field approximation described in Mussa-Ivaldi (1992). According to this approach, an accurate and smooth approximation of any FF measured on the 2D experimental grid can be expressed as the linear combination of a finite set of K irrotational and solenoidal fields, denoted by \varphi \left(x\right) and \psi \left(x\right) , respectively:
where x is an arbitrary position in the plane, {t}^{i} is a fixed point in the plane denoted as the “center” of the field, and {c}_{i} and {d}_{i} are the weights of the irrotational and solenoidal basis fields, respectively. The coefficients {c}_{i} and {d}_{i} are computed from the solution of the algebraic problem:
where {x}^{j} is the set of M positions where the field has been measured and {v}^{j} , the corresponding field values. The basis fields considered by Mussa-Ivaldi (1992) present a simple geometric structure with distinctive radial and circulating patterns for which the verification of the conditions to be irrotational ( \nabla \times \varphi = 0) and solenoidal ( \nabla \times \psi = 0) is straightforward.
As irrotational fields are conservative, the smaller the contribution of the solenoidal basis fields to the decomposition defined in equation (8), the more accurately the FF can be characterized as conservative. In this study, FFs were categorized as conservative if the contribution of the irrotational basis fields to the field approximation defined in equation (8) was larger than the contribution of the solenoidal components. For each FF derived from the experimental data, the corresponding system of linear equations shown in equation (9) was solved in Matlab using the built-in function “\” (backlash operator).
RESULTS
Visual examination of hindlimb force fields
We systematically and comprehensively stimulated the entire length of the lumbosacral spinal cord at threshold power, moving from the rostral to caudal ends in steps of 100 µm. As magnitude and direction of the elicited isometric force at the ankle depend on ankle position (Bizzi et al., 1991), at each spinal locus, laser stimulation (200 ms) was delivered when the ankle was fixed at each of the 4×4=16 locations in the workspace. This allowed us to construct FFs that spanned the workspace for every spinal locus stimulated (Figure 1A). In addition, to identify any temporal evolution of the FF within the 200 ms stimulation window, we examined the temporal evolution of the fields at every spinal locus in 20 ms time bins.
Here, we show examples of FFs observed at different times during stimulation trials elicited from rostral (Figure 1B) and caudal loci (Figure 1C), respectively. In general, the overall FF structure appeared to depend strongly on the stimulation location on the spinal cord. Rostral loci tended to produce fields with anteriorly or anterodorsally directed force vectors, while caudal loci tended to produce fields with posteriorly or posterodorsally directed vectors. The overall pattern of the field and direction of the force vectors were fairly constant at the different time steps, but the force-vector magnitude changed over time.
Variability of raw force fields
We next characterized the varieties of FFs obtained and analyzed how their structures may depend on spinal stimulation location. As the FF at each locus may exhibit temporal changes within the stimulation window, we examined the fields from all loci observed at a fixed time point within the stimulation window (100–120 ms from laser onset), at which time the field would stabilize in structure (Figure 1; see below, Figure 4). As a first step to account for FF variability, we categorized the FFs by k-means clustering.
To illustrate our analysis, 46 FFs from one mouse (mouse 9) were grouped into four clusters (with this number of clusters indicated by maximum silhouette value). Figure 2A shows the distribution of the spinal loci corresponding to these clusters along the length of the lumbosacral spinal cord. While fields belonging to the same cluster tended to lie adjacent to each other, their spatial distributions also overlapped substantially. However, the four clusters did not well explain the variety of raw FFs along the spinal cord. Figure 2A also shows several examples of raw FFs (numbered 1 to 6) belonging to specific clusters. These raw FFs did not well match the centroids of the clusters to which they were classified by k-means. For instance, the centroid of cluster 1 (Figure 2A, purple X; Figure 2B), characterized by anterodorsally directed force vectors, did not correspond well to the structures of the two FF examples belonging to cluster 1 (Figure 2A, fields 1 and 6). Fields of this cluster were not only found in the most rostral, middle, and most caudal portions of the lumbosacral cord, intermingling with the distributions of other clusters, but its centroid only well matched the raw FFs from the middle section of the spinal cord (Figure 2A, field 3). These observations suggest that the identified force-field clusters exhibit only weak topography, at best, and/or the variability of field structure is substantial enough to belie simple categorization into a small number of clusters. We examined whether the latter possibility is true by quantifying the extent to which the centroid of each cluster may explain the variation of FFs within the cluster using adjusted R2. Results showed that adjusted R2 values were low (0.62±0.21, mean±SD) across all clusters in all mice (Figure 2C). Thus, the entire collection of lumbosacral FFs elicited at threshold power exhibited enough variability such that they could not be adequately summarized by grouping them into just a few clusters.
Figure
2.
Variability in FFs across spinal stimulation locations across mice
A: Lower part shows examples of six FFs elicited at different locations along the spinal cord of one mouse. Upper part shows distributions along the spinal cord of FF clusters identified in the same mouse; each color corresponds to a specific cluster. B: Cluster centroids of FF clusters identified from FFs of one mouse. FFs at 100–120 ms after stimulation onset were used in clustering. C: Adjusted R2 values of cluster centroids for each mouse. D: Centroids of three FF clusters extracted from raw FFs in all mice. E: Adjusted R2 of cluster centroids in D.
We then identified the clusters from the FFs of all 15 mice and identified three clusters (Figure 2D). Again, the cluster centroids only explained the FFs in their respective clusters with low adjusted R2 values. Indeed, only one cluster had an R2 value greater than 0.50 (Figure 2E), suggesting high FF variability across animals.
We then examined the variability of FFs across time within the stimulation trials. For each animal and each spinal stimulation locus, we calculated the change in direction between force vectors from consecutive 20 ms time steps ( {\Delta \alpha }_{t}) , averaged across the 16 ankle locations. For a particular spinal locus (Figure 3A), | {\Delta \alpha }_{t} | varied between 4.98° and 29.19° (SD of 6.34°) within the time window 20–600 ms from stimulation onset. Average | {\Delta \alpha }_{t} | calculated across all spinal loci (Figure 3B) varied between 3.55° and 17.21° (SD of 2.63°). In both cases, the largest direction changes occurred at ~20 ms from stimulation onset and ~300 ms from stimulation onset (i.e., ~100 ms from offset), suggesting that temporal variation in force angle between FFs may be independent of stimulation loci. Indeed, the same | {\Delta \alpha }_{t} | peaks occurred at similar times even when the average was calculated across animals (Figure 3C). It is worth noting that the presence of two activity peaks (at 20 and 300 ms) may reflect the peculiar kinetics of ChR2 channels, as further explained in Discussion section below.
Figure
3.
Variability in FFs across time
Average angle variation in degrees of FF vectors across time, calculated for one spinal locus of one animal (A), for all spinal loci of one animal (B), and for all loci of all animals (C). Blue shadows indicate times with stimulation on.
Basic force fields extracted from raw force fields
The high variability of FFs across spinal stimulation loci and animals prompted us to further investigate the potential existence of more FF field primitives that could explain the raw FFs when combined linearly.
We applied a gradient descent algorithm to extract fundamental BFFs (equation (3)) from the recorded spinal FFs elicited at both threshold and above threshold powers and from all time steps. At threshold power, for both individual mice and all mice combined, the number of BFFs extracted were 4 or 5 (4.46±0.74) except for two mice (in which three and six BFFs were extracted, respectively). To verify that these BFFs were indeed elementary primitives and to ensure that their relatively low number was not a consequence of low stimulation intensity recruiting too few interneuronal pools, we stimulated some blocks with higher laser power. We then analyzed these blocks and again identified 4–5 (4.5±1.3) BFFs. As seen in Figure 4, the number of BFFs remained the same whether they were extracted from blocks with threshold-intensity stimulation (Figure 4A) or blocks with high-intensity stimulation (Figure 4B). Therefore, stimulation intensity did not affect the number of BFFs extracted (Table 1), suggesting that BFFs may represent more elemental primitives underlying spinal FFs.
Table
1.
Number of BFFs extracted at threshold vs. above-threshold stimulation intensities (mice 10 and 24 were not stimulated above threshold)
Figure
4.
Examples of gradient descent-derived FFs
A, B: show four BFFs extracted from one mouse when stimulation was at threshold (blue) and high intensity (red), respectively. C: Reconstruction of cluster centroids of four BFFs extracted from all animals. D: Adjusted R2 of cluster centroids in C.
We also found that in some mice, compared with BFFs from threshold stimulations, BFFs derived from high-intensity stimulations were less distinct from each other, showing smaller differences in direction patterns of their vectors. As seen in Figure 4B, three BFFs from high-intensity stimulation showed a similar posterodorsal pattern, and only one (leftmost field) showed an anteriorly directed field. In contrast to BFFs elicited at threshold (Figure 4A), high-intensity BFFs did not include an anteroventrally directed field. Thus, above-threshold stimulation may have increased activation of a subset of BFFs whose over-representation across all stimulation sites obscured the structures of less prominent BFFs, thereby biasing the gradient-descent algorithm to return outputs toward the direction of dominant BFFs.
To control for the possibility that artefactual mechanical stimulation of the spinal cord by the laser tip during force generation may produce certain force patterns, especially under high-intensity pulse delivery, we performed additional controls on the distance of the fiber tip from the spinal cord in four animals. Figure 5 shows an example of a mouse in which stimulation was delivered at threshold and above-threshold intensity and the fiber was either slightly touching or positioned 50 µm above the spinal cord. In this case, regardless of the distance between the spinal cord surface and laser tip, stimulation intensity did not affect the number of BFFs extracted. We also compared BFFs by calculating cosine similarity between the fields under different conditions (Figure 5, A vs. B and C vs. D). The cosine similarity values were ≥0.75 in 75% of cases, indicating that the distance of the laser tip from the spinal cord surface did not affect the BFFs extracted.
Figure
5.
Comparison between BFFs elicited by laser stimulation at different heights above the spinal cord
A, B: BFFs elicited at threshold-intensity stimulation are shown in the upper part of the figure. The laser tip was located 50 µm above (A) or slightly touching the spinal cord (B). BFFs elicited at above threshold-intensity stimulation are shown in the lower part of the figure. C, D: The laser tip was located 50 µm above (C) or slightly touching the spinal cord (D). BFFs extracted under different conditions shared similar features and number. Similarity values above 0.65 indicate that distance of the laser tip from the spinal cord surface does not affect the BFFs extracted.
We then examined whether the BFFs extracted from FFs at threshold power were consistent across animals by clustering all BFFs using the k-means algorithm. We identified four clusters with vectors oriented anteroventrally (Figure 4C, cluster 1), posterodorsally (clusters 2 and 3), and ventrally (cluster 4). We investigated whether the extracted clusters could account for BFF variability by calculating the adjusted R2 of their centroids. The adjusted R2 values were >0.51 in three of the four clusters (Figure 4D) and were higher than the values derived from the raw FFs (Figure 2C, E).
Topography of basic force fields
As demonstrated above, the raw FFs elicited from the rostral and caudal spinal loci tended to comprise force vectors with different orientations (Figure 1), thus hinting at the possibility that a limited number of prototypical FFs are topographically organized along the lumbosacral spinal cord. However, clustering of the laser-elicited raw FFs did not clearly capture the structures of the force-field prototypes and their topography (Figure 2). We reasoned that if FF diversity could be explained by a few underlying BFFs (Figure 4), any topographical organization of the FFs could be revealed by the BFFs being preferentially represented in particular regions of the spinal cord. Thus, we analyzed how BFF coefficients of activation varied as a function of spinal stimulation location.
Figure 6 shows examples of BFFs from two mice, extracted from FFs evoked at threshold power, and their representations along the spinal cord, as indicated by the activation coefficients of the BFFs. Even allowing for small differences between mice, BFFs with anteroventrally oriented vectors were more represented in rostral stimulation loci of the spinal cord (e.g., BFF1 and BFF2 in Figure 6A; BFF1 in Figure 6B), while BFFs with posterodorsally oriented vectors were more represented in caudal loci (e.g., BFF4 in Figure 6A; BFF4 in Figure 6B). This pattern is consistent with the relationship between force-vector direction and spinal stimulation location observed in the raw FFs discussed above (Figure 1).
Figure
6.
BFF topography
A, B: Upper part of the figure shows two examples of BFF distributions along the spinal cord in two different animals. Heat maps show that BFFs with anteroventrally directed vectors were mostly represented in the rostral part of the spinal cord, while BFFs with posterodorsal orientation tended to be represented in the caudal part of the spinal cord. Lower part of the figure shows topography of the BFF clusters. C, D: BFF cluster distributions on the spinal cord of one animal (C) and all animals (D) are shown. BFF clusters were likewise topographically represented on the spinal cord, with clusters showing anteroventral (cluster 1) and posterodorsal (cluster 3) orientation mostly represented in the rostral and caudal parts, respectively. In C, which shows the results from the same mouse in B (mouse 11), two BFFs (BFF3 and BFF4) were grouped into the same cluster (cluster 2), and both BFF3 and BFF4 in this mouse and cluster 2 were represented in the caudal part of the spinal cord.
As demonstrated earlier, the BFFs of all mice were categorizable into four clusters (Figure 4C). We confirmed that individual BFFs grouped in the anteroventrally oriented cluster (Figure 4C, cluster 1) were more prominent in the rostral spinal loci, whereas BFFs grouped in the posterodorsally oriented clusters (Figure 4C, clusters 2 and 3) were more prominent in the caudal loci. For example, in mouse 11, the anteroventrally oriented BFF1 (Figure 6B) grouped under cluster 1 was indeed most prominent in the rostral lumbosacral spinal cord (Figure 6C). The posterodorsally oriented BFF2 (Figure 6B) belonging to cluster 3 was represented in the middle section of the exposed spinal cord. BFF3 and BFF4 (Figure 6B), with dorsally and posterodorsally directed vectors, respectively, were both classified in cluster 2 and mainly expressed in the most caudal portion of the spinal cord.
We further examined whether the topographical distribution of clusters in the lumbosacral spinal cord was consistent across animals. For each cluster, the coefficient distributions of all BFFs for all mice were combined and averaged. Even allowing for inter-animal variability, anteroventrally directed cluster 1 remained the most prominent in the rostral spinal cord (Figure 6D, blue), while posterodorsally directed cluster 3 remained the most represented in the caudal cord (Figure 6D, orange), thus replicating the individual animal results.
It is important to emphasize that even though each cluster was preferentially represented in a particular region of the spinal cord, their distributions still overlapped considerably, both in individual mice and on average. For example, in mouse 11, the overlap of all four BFFs was most obvious in the caudal half of the spinal cord (Figure 6B). In the averaged representations, clusters 2 and 4 showed more consistent activations across all portions of the lumbosacral spinal cord (Figure 6D).
Convergence and conservativity
Several previous studies on motor primitives have investigated the convergence of FF towards an equilibrium point (Bizzi et al., 1991, 1995; Caggiano et al., 2016; Giszter et al., 1993; Lemay et al., 2002; Mussa-Ivaldi et al., 1994; Mussa-Ivaldi & Giszter, 1992). Here, however, the force vectors in the FFs and BFFs did not show any clear convergence towards any equilibrium point (e.g., Figure 1). Therefore, we studied the overall trends in vector divergence (or equivalently, convergence) of the FFs and BFFs using the divergence measure (equation (6), with positive values indicating divergent fluxes) to quantify the degree of vector divergence in each field. Of the raw FFs from all mice, 61% had negative divergence values and were therefore considered convergent overall. Furthermore, FFs elicited by threshold power in the more rostral parts of the spinal cord tended to be more convergent, while those in the caudal loci of the spinal cord were more divergent (Figure 7A). The FFs from the rostral spinal cord also become divergent when stimulation was delivered at above-threshold power (Figure 7A).
Figure
7.
FF divergence
A: At threshold-intensity stimulation, convergent FFs were elicited at more rostral spinal locations (red squares) and divergent FFs (blue triangles) were elicited at more caudal loci (blue triangles). In some cases, high-intensity stimulation also elicited divergent FFs at rostral locations. In mouse 9, blue shadows indicate blocks where stimulation intensity was above threshold. B: Linear model shows that divergence value was linearly related to stimulation location on the spinal cord. C: Coefficient-weighted divergence of four BFF clusters shown in Figure 4. Divergence values were weighted with gradient descent coefficients of the BFFs and normalized to the maximum absolute value for each animal. Negative values indicate convergence (red squares) and positive values indicate divergence (blue triangles).
To gain further insight into how FF divergence may be correlated with stimulation location and intensity, we applied a linear regression model. The linear model confirmed that stimulation location was correlated with FF divergence (P<0.05; Table 2). The more caudal the stimulation location, the higher the divergent value and the more divergent the FF (Figure 7B). On the other hand, stimulation intensity alone had no significant effect on divergence (P>0.05), but the interaction between stimulation intensity and location was significant (P<0.05). Divergence values were higher when high-intensity stimulation was delivered at more posterior parts of the spinal cord.
Table
2.
Linear regression model correlating divergence values with stimulation intensity and stimulation location
Estimate
SE
tStat
P-value
(Intercept)
–0.13586
0.015139
–8.9744
4.366× {10}^{-18}
Location
0.15305
0.027565
5.5522
4.3735× {10}^{-8}
Stimulation intensity
0.04307
0.0095633
4.5037
8.1413× {10}^{-1}
Location-intensity interaction
−0.039897
0.018457
−2.1617
0.031071
Number of observations: 560, Error degrees of freedom: 556
Root mean squared error: 0.0906
R-squared: 0.132, Adjusted R-squared: 0.127
F-statistic vs. constant model: 28.1, P=6.16×10⁻¹⁷
Divergence was positively correlated with stimulation location (P<0.05) and with interaction between stimulation intensity and location, but it was not correlated with the stimulation intensity alone (P>0.05).
In contrast, the BFFs appeared to be more divergent than the FFs overall, showing convergence (negative divergence values) in 44% of the fields. Grouping BFF divergence values according to their corresponding clusters (as identified in Figure 4), we confirmed that, on average, all clusters tended to be divergent, irrespective of where they were most represented in the spinal cord (Figure 7C). It may be that when BFFs are combined, more FFs are formed with more dominant contributions from convergent BFFs, thus explaining the difference in the percentage of convergent fields between FFs and BFFs.
Finally, we determined FF conservativity by calculating the irrotational and solenoidal components of the fields (equation (9)). We found that 60% of FFs and 63% of BFFs showed higher irrotational components and were therefore considered conservative. Nevertheless, even in fields classified as non-conservative, the irrotational component still contributed to at least 40% of the field, indicating that these fields cannot be considered purely non-conservative.
Spinalized animals
To evaluate whether the extracted BFFs are structured by neuronal networks in the spinal cord independent of supraspinal inputs, we stimulated 53 spinal cord loci in two spinalized animals. The results obtained were consistent with those obtained in intact mice. As shown in Figure 8, five BFFs were extracted and their topographical distributions along the spinal cord followed the same pattern as BFFs extracted in intact mice. In fact, the post-spinalized BFFs with anteroventrally directed vectors were mostly represented in the rostral part of the spinal cord, while BFFs with posterodorsally directed vectors were mostly represented in the mid-to-caudal portion of the spinal cord.
Figure
8.
BFFs of spinalized animals
A, B: Example of BFFs extracted from a spinalized animal (A) and their distributions along the spinal cord (B). Heat map shows that BFFs with anteroventrally directed vectors were mostly represented in the rostral part of the spinal cord, while BFFs with posterodorsally directed vectors were represented in the mid-caudal part of the spinal cord, showing a pattern similar to that of intact animals.
Multiple experiments on motor modules have relied on electrical (Bizzi et al., 1991; Giszter et al., 1993; Lemay et al., 2001), chemical (Saltiel et al., 2001), or optogenetic (Caggiano et al., 2016; Levine et al., 2014) stimulations delivered to the spinal cord to elicit isometric forces when the limb endpoint is fixed at multiple locations in the workspace. The resulting spatial fields of evoked forces have been interpreted as representations of fundamental motor modules (Bizzi & Cheung, 2013; Cheung & Seki, 2021). In this study, we asked whether these force fields (FFs) are indeed the most basic elements of movement generation, or whether they are themselves formed by even more fundamental building blocks.
Here, we systematically mapped the murine lumbosacral spinal cord using optogenetics and our extensive coverage of the whole lumbosacral spinal cord with finely spaced stimulation loci allowed us to stimulate excitatory neurons at a high number of spinal locations, thus generating sufficient FF variability to permit extraction of their basic components. We used Thy-ChR2/EYFP transgenic mice in which ChR2 is expressed in excitatory neurons of the intermediate gray matter and ventral horn of the spinal cord. The rationale for using this transgenic strain was based on previous study aimed at dissecting the neuronal types that underpin spinal motor modules (Caggiano et al., 2016). Comparing the FFs generated from the stimulation of the lumbosacral spinal cord in Thy1-ChR2/EYFP mice with those in Chat-ChR2-EYFP mice (in which ChR2 is expressed in the motoneurons), Caggiano et al. (2016) concluded that the structures of neuromotor modules originate from excitatory spinal interneurons.
In our experimental setup, the laser was positioned above the spinal cord, with the fiber tip slightly touching the surface. As a laser can activate approximatively 1 mm3 volume of tissue (Ozden et al., 2013), neurons in the intermediate gray matter and ventral horn, located about 600 µm from the spinal cord surface, can be penetrated by the laser beam and stimulated. From previous studies (Levine et al., 2014), the interneurons with monosynaptic outputs to the motoneurons of different muscles are also mostly located in the spinal laminae reachable by our laser, positioned about 300 µm from midline. Therefore, we inferred that our FFs were likely derived by the recruitment of premotor interneurons in the intermediate gray matter and ventral horn.
Furthermore, while it is possible that upon laser stimulation of Thy1 mice, even at threshold power, some motoneurons may have been directly recruited, their stimulation would result in FFs characterized only by parallel vectors, unlike those elicited by stimulation of interneurons that consist of non-parallel vectors, as demonstrated previously (Bizzi et al., 1991; Caggiano et al., 2016). Thus, in our study, since non-parallel force vectors were the source of FF variability on which the gradient descent algorithm relied to extract BFFs from FFs, we deduced that the BFFs and their topographical distributions reflect the organization of excitatory interneurons along the lumbosacral spinal cord.
By examining the temporal evolution of force angles in FFs during stimulation, we found that the largest change in force direction occurred at ~20 ms and ~300 ms from stimulation onset (Figure 3), and that the timing of these changes may be independent of stimulation loci (Figure 3B, C). These peaks may reflect the activity peaks of certain neurons arising from the peculiar kinetics of the ChR2 channel. Mondello et al. (2018) recently showed that optogenetic surface stimulation of the rat spinal cord produces an activation peak at ~8 ms, later than that from electrical microstimulation, suggesting that the initial activity from optical stimulation may need to pass through more synapses before activating motoneurons. In addition, they also found that light stimulation evokes a second wave of opsin activation at ~5 ms from the first peak. This observation of two activity peaks in rats is consistent with our observations in mice.
Basic force fields as rudimentary motor submodules
Unlike earlier studies on FFs (e.g., Caggiano et al., 2016), we used a gradient descent algorithm to decompose raw FF data into more basic force fields. We demonstrated that the FFs generated along the entire length of the lumbosacral spinal cord could be decomposed in 4–5 basic force fields (BFFs), which were distributed along the spinal cord with different topographies. As stimulation intensity was set at the minimum necessary threshold level, it may be argued that the small number of observed BFFs was merely due to the activation of a small number of interneurons. However, in a subset of animals, we used laser power levels far above threshold, leading to current spread that should have recruited many more interneurons, as evidenced by the resulting visible movement of the contralateral hindlimb. Notably, the number and force patterns of the extracted BFFs (Table 1; Figure 4) remained mostly unaltered. Thus, the BFFs may be a collection of rudimentary spinal motor modules accessible by descending commands (d’Avella & Bizzi, 1998) and sensory afferents (Loeb et al., 1993) for producing hindlimb movement.
To further demonstrate whether BFFs are primary elements underlying FFs at the spinal stimulation sites, we examined their topographical distributions. We found that in individual mice, BFFs were represented at each spinal locus in different proportions (Figure 6 A, B). Their spatial representations were consistent with the structures of the raw FFs elicited at the stimulation sites, as the vector directions of the FFs from a spinal region corresponded to the force directions of the BFFs most represented in that region. Clustering of BFFs across animals confirmed that BFFs belonging to the same cluster also showed similar topographical distributions along the spinal cord (Figure 6C, D). The consistencies between the FFs and BFFs and between BFFs from different mice suggest that BFFs reflect structures possibly encoded by premotor interneuronal networks in the spinal cord.
Thus, light-evoked FFs appear to be the result of a combination of even more basic components, each weighted by a specific coefficient that influences how it contributes to the final structure of the FF. Earlier experimental and computational studies have suggested that evoked FFs are modules that can be combined to produce behaviorally relevant endpoint trajectories (Giszter et al., 1993; Mussa-Ivaldi & Giszter, 1992). If each FF itself is a product of a combination of BFFs, then BFFs may be regarded as submodules that can be flexibly merged to form different behaviorally relevant modules. Using a metaphor from linguistics (Bizzi & Ajemian, 2015), we may consider BFFs as phonemes of movement, FFs as syllables composed of phonemes, and the resulting trajectories as words obtained by combining FF syllables. This interpretation is consistent with recent findings that certain muscle synergies observed in elite runners (Cheung et al., 2020) and stroke survivors (Cheung et al., 2012; Clark et al., 2010) are themselves produced by merging multiple more rudimentary muscle synergies.
Topography of basic force fields
When plotting the activation coefficients of the BFFs against normalized spinal stimulation loci, we found that the basic fields with anteriorly directed forces tended to be more prominently represented in the rostral region of the lumbosacral cord, whereas those with posteriorly directed forces were more prominently represented in the caudal region (Figure 6). Despite the tendency of regional localization in BFF representations, their distributions nonetheless overlapped considerably (Figure 6C, D). This partially localized yet overlapping topographical organization of the BFFs well fits the organization of muscle synergies in the frog lumbar spinal cord derived by focal N-methyl-D-aspartate (NMDA) iontophoresis (Saltiel et al., 2001, 2005, 2016). Of note, the degree of BFF representation on the spinal cord, as indicated by the magnitude of its coefficients in our map (Figure 6), may or may not align with the exact anatomical location of the neuronal network that organizes the structure of the BFF. A prominent representation at a locus only implies that the BFF can be best accessed at that locus with stimulation (Cheung & Seki, 2021; Rana et al., 2015). Revealing the actual neuronal network that coordinates the muscles responsible for BFFs will require additional detailed dissection involving concurrent neural and muscle recordings (Levine et al., 2014; Takei et al., 2017).
Together, the BFFs from the rostral to caudal regions of the lumbosacral spinal cord constituted a sequence of fields with force vectors first oriented anteriorly, then becoming successively more posterior (Figure 6). With this topographical organization, a rostral-to-caudal traveling wave of neural activities across the lumbosacral spinal cord should, in principle, generate a swing-to-stance gait cycle (Saltiel et al., 2016, 2017). Thus, even in the mammalian spinal cord, it may be possible that the spatial distributions of motor module access points are arranged in a topography that facilitates proper temporal sequencing of motor patterns through a traveling wave.
Divergence of basic force fields
Interestingly, the identified BFFs did not have any clear equilibrium point within the field. Most BFFs were divergent, and only about 60% of the raw FFs showed convergence. These results contrast with previous bullfrog studies in which intraspinal stimulation of interneurons resulted in convergent FFs (Giszter et al., 1993). These apparently conflicting results may be explained as follows. In this study, we applied threshold power for stimulation so as to involve the smallest number of interneurons possible, and thus recruit as few modules as possible during each stimulation trial. Furthermore, we employed a gradient descent algorithm to decompose all FFs into more fundamental BFFs. Presumably, the number of recruited muscles underlying each identified BFF should be lower than those recruited for any FF in earlier studies, at least on average. If we assume that any evoked FF or BFF can be explained by the linear summation of FFs derived by stimulating each muscle recruited for the FF or BFF, respectively (Giszter et al., 1992, 1993), the FF or BFF should be closer to the field of its underlying individual muscles, which may comprise divergent, convergent, or parallel force vectors (Giszter et al., 1992, 1993; Loeb et al., 2000). Therefore, the smaller percentage of convergent fields in our data may simply be a consequence of a smaller number of muscles recruited in each FF or BFF. In other words, the more muscles that are activated, the more likely the limb endpoint will eventually settle on an equilibrium position within the workspace due to the antagonistic forces of the recruited and other muscles, and thus the higher the chance of observing a convergent FF.
In species beyond lower vertebrates, Aoyagi et al. (2004) found that simultaneous activation of different muscles in cats produces convergent fields, but activation of single muscles produces parallel force vectors, in agreement with our argument. These authors likewise concluded that whether convergence to an equilibrium point is observed will depend on the number of muscles activated, specific muscles activated, and number of joints spanned by the activated muscles. Indeed, in multiple studies on mice (Caggiano et al., 2016), rats (Tresch & Bizzi, 1999), cats (Aoyagi et al., 2004; Ethier et al., 2006; Lemay & Grill, 2004), and monkeys (Yaron et al., 2020), many or most FFs derived from cortical or spinal stimulations also lack a clear equilibrium point within the workspace.
CONCLUSION
What constitutes the most fundamental building blocks of motor outputs? By exhaustively eliciting force fields from the entire length of the murine lumbosacral spinal cord using minimal laser power, and by using a gradient descent algorithm to decompose the force fields into their underlying components, we identified four basic force fields that should be closer to being the most rudimentary modules of hindlimb control. These basic force fields may well represent submodules that can be flexibly merged (Cheung et al., 2020) to form a library of motor modules (Ting et al., 2015) suitable for constructing different innate or learned motor behaviors.
COMPETING INTERESTS
The authors declare that they have no competing interests.
AUTHORS’ CONTRIBUTIONS
P.S. conceived and designed the study, collected and analyzed the data, and wrote the paper. V.C.K.C. conceived and designed the study and wrote the paper. All authors read and approved the final version of the manuscript.
Aoyagi Y, Stein RB, Mushahwar VK, et al. 2004. The role of neuromuscular properties in determining the end-point of a movement. IEEE Transactions on Neural Systems and Rehabilitation Engineering, 12(1): 12−23. DOI: 10.1109/TNSRE.2003.823265
Bizzi E, Ajemian R. 2015. A hard scientific quest: understanding voluntary movements. Daedalus, 144(1): 83−95. DOI: 10.1162/DAED_a_00324
Bizzi E, Cheung VCK. 2013. The neural origin of muscle synergies. Frontiers in Computational Neuroscience, 7: 51.
Bizzi E, Giszter SF, Loeb E, et al. 1995. Modular organization of motor behavior in the frog’s spinal cord. Trends in Neurosciences, 18(10): 442−446. DOI: 10.1016/0166-2236(95)94494-P
Bizzi E, Hogan N, Mussa-Ivaldi FA, et al. 1992. Does the nervous system use equilibrium-point control to guide single and multiple joint movements?. Behavioral and Brain Sciences, 15(4): 603−613. DOI: 10.1017/S0140525X00072538
Bizzi E, Mussa-Ivaldi FA, Giszter S. 1991. Computations underlying the execution of movement: a biological perspective. Science, 253(5017): 287−291. DOI: 10.1126/science.1857964
Caggiano V, Cheung VCK, Bizzi E. 2016. An optogenetic demonstration of motor modularity in the mammalian spinal cord. Scientific Reports, 6: 35185. DOI: 10.1038/srep35185
Cheung VCK, Cheung BMF, Zhang JH, et al. 2020. Plasticity of muscle synergies through fractionation and merging during development and training of human runners. Nature Communications, 11(1): 4356. DOI: 10.1038/s41467-020-18210-4
Cheung VCK, d’Avella A, Tresch MC, et al. 2005. Central and sensory contributions to the activation and organization of muscle synergies during natural motor behaviors. Journal of Neuroscience, 25(27): 6419−6434. DOI: 10.1523/JNEUROSCI.4904-04.2005
Cheung VCK, Seki K. 2021. Approaches to revealing the neural basis of muscle synergies: a review and a critique. Journal of Neurophysiology, 125(5): 1580−1597. DOI: 10.1152/jn.00625.2019
Cheung VCK, Turolla A, Agostini M, et al. 2012. Muscle synergy patterns as physiological markers of motor cortical damage. Proceedings of the National Academy of Sciences of the United States of America, 109(36): 14652−14656. DOI: 10.1073/pnas.1212056109
Clark DJ, Ting LH, Zajac FE, et al. 2010. Merging of healthy motor modules predicts reduced locomotor performance and muscle coordination complexity post-stroke. Journal of Neurophysiology, 103(2): 844−857. DOI: 10.1152/jn.00825.2009
d’Avella A, Bizzi E. 1998. Low dimensionality of supraspinally induced force fields. Proceedings of the National Academy of Sciences of the United States of America, 95(13): 7711−7714. DOI: 10.1073/pnas.95.13.7711
Devarajan K, Cheung VCK. 2014. On nonnegative matrix factorization algorithms for signal-dependent noise with application to electromyography data. Neural Computation, 26(6): 1128−1168. DOI: 10.1162/NECO_a_00576
Ethier C, Brizzi L, Darling WG, et al. 2006. Linear summation of cat motor cortex outputs. Journal of Neuroscience, 26(20): 5574−5581. DOI: 10.1523/JNEUROSCI.5332-05.2006
Feldman AG. 1986. Once more on the equilibrium-point hypothesis (λ model) for motor control. Journal of Motor Behavior, 18(1): 17−54. DOI: 10.1080/00222895.1986.10735369
Giszter S, Kargo W. 2000. Movement organization in the frog spinal cord: prerational intelligence?. In: Cruse H, Dean J, Ritter H. Prerational Intelligence: Adaptive Behavior and Intelligent Systems Without Symbols and Logic, Volume 1, Volume 2 Prerational Intelligence: Interdisciplinary Perspectives on the Behavior of Natural and Artificial Systems, Volume 3. Dordrecht: Springer, 323–341.
Giszter SF, Bizzi E, Mussa-Ivaldi FA. 1992. Motor organization in the frog’s spinal cord. In: Eeckman FH. Analysis and Modeling of Neural Systems. Boston: Springer, 377–392.
Giszter SF, Mussa-Ivaldi FA, Bizzi E. 1993. Convergent force fields organized in the frog’s spinal cord. Journal of Neuroscience, 13(2): 467−491. DOI: 10.1523/JNEUROSCI.13-02-00467.1993
Harrison M, O'Brien A, Adams L, et al. 2013. Vertebral landmarks for the identification of spinal cord segments in the mouse. NeuroImage, 68: 22−29. DOI: 10.1016/j.neuroimage.2012.11.048
Lee DD, Seung HS. 1999. Learning the parts of objects by non-negative matrix factorization. Nature, 401(6755): 788−791. DOI: 10.1038/44565
Lemay MA, Calagan JE, Hogan N, et al. 2001. Modulation and vectorial summation of the spinalized frog’s hindlimb end-point force produced by intraspinal electrical stimulation of the cord. IEEE Transactions on Neural Systems and Rehabilitation Engineering, 9(1): 12−23. DOI: 10.1109/7333.918272
Lemay MA, McConnell GC, Kao T, et al. 2002. Endpoint forces obtained during intraspinal microstimulation of the cat lumbar spinal cord - experimental and biomechanical model results. In: Proceedings of the IEEE 28th Annual Northeast Bioengineering Conference (IEEE Cat. No. 02CH37342). Philadelphia: IEEE, 113–114.
Lemay MA, Grill WM. 2004. Modularity of motor output evoked by intraspinal microstimulation in cats. Journal of Neurophysiology, 91(1): 502−514. DOI: 10.1152/jn.00235.2003
Levine AJ, Hinckley CA, Hilde KL, et al. 2014. Identification of a cellular node for motor control pathways. Nature Neuroscience, 17(4): 586−593. DOI: 10.1038/nn.3675
Liu K, Lu Y, Lee JK, Samara R, et al. 2010. PTEN deletion enhances the regenerative ability of adult corticospinal neurons. Nature Neuroscience, 13(9): 1075−1081. DOI: 10.1038/nn.2603
Loeb EP, Giszter SF, Borghesani P, et al. 1993. Effects of dorsal root cut on the forces evoked by spinal microstimulation in the spinalized frog. Somatosensory & Motor Research, 10(1): 81−95.
Loeb EP, Giszter SF, Saltiel P, et al. 2000. Output units of motor behavior: an experimental and modeling study. Journal of Cognitive Neuroscience, 12(1): 78−97. DOI: 10.1162/08989290051137611
Mattis J, Tye KM, Ferenczi EA, et al. 2012. Principles for applying optogenetic tools derived from direct comparative analysis of microbial opsins. Nature Methods, 9(2): 159−172. DOI: 10.1038/nmeth.1808
Mondello SE, Sunshine MD, Fischedick AE, et al. 2018. Optogenetic surface stimulation of the rat cervical spinal cord. Journal of Neurophysiology, 120(2): 795−811. DOI: 10.1152/jn.00461.2017
Mussa-Ivaldi FA. 1992. From basis functions to basis fields: vector field approximation from sparse data. Biological Cybernetics, 67(6): 479−489. DOI: 10.1007/BF00198755
Mussa-Ivaldi FA, Giszter SF. 1992. Vector field approximation: a computational paradigm for motor control and learning. Biological Cybernetics, 67(6): 491−500. DOI: 10.1007/BF00198756
Mussa-Ivaldi FA, Giszter SF, Bizzi E. 1994. Linear combinations of primitives in vertebrate motor control. Proceedings of the National Academy of Sciences of the United States of America, 91(16): 7534−7538. DOI: 10.1073/pnas.91.16.7534
Overduin SA, d’Avella A, Carmena JM, et al. 2012. Microstimulation activates a handful of muscle synergies. Neuron, 76(6): 1071−1077. DOI: 10.1016/j.neuron.2012.10.018
Ozden I, Wang J, Lu Y, et al. 2013. A coaxial optrode as multifunction write-read probe for optogenetic studies in non-human primates. Journal of Neuroscience Methods, 219(1): 142−154. DOI: 10.1016/j.jneumeth.2013.06.011
Rana M, Yani MS, Asavasopon S, et al. 2015. Brain connectivity associated with muscle synergies in humans. Journal of Neuroscience, 35(44): 14708−14716. DOI: 10.1523/JNEUROSCI.1971-15.2015
Rathelot JA, Strick PL. 2006. Muscle representation in the macaque motor cortex: an anatomical perspective. Proceedings of the National Academy of Sciences of the United States of America, 103(21): 8257−8262. DOI: 10.1073/pnas.0602933103
Saltiel P, D'Avella A, Tresch MC, et al. 2017. Critical points and traveling wave in locomotion: experimental evidence and some theoretical considerations. Frontiers in Neural Circuits, 11: 98. DOI: 10.3389/fncir.2017.00098
Saltiel P, D'Avella A, Wyler-Duda K, et al. 2016. Synergy temporal sequences and topography in the spinal cord: evidence for a traveling wave in frog locomotion. Brain Structure and Function, 221(8): 3869−3890. DOI: 10.1007/s00429-015-1133-5
Saltiel P, Wyler-Duda K, D'Avella A, et al. 2005. Localization and connectivity in spinal interneuronal networks: the adduction–caudal extension–flexion rhythm in the frog. Journal of Neurophysiology, 94(3): 2120−2138. DOI: 10.1152/jn.00117.2005
Saltiel P, Wyler-Duda K, D'Avella A, et al. 2001. Muscle synergies encoded within the spinal cord: evidence from focal intraspinal NMDA iontophoresis in the frog. Journal of Neurophysiology, 85(2): 605−619. DOI: 10.1152/jn.2001.85.2.605
Savage N. 2019. How AI and neuroscience drive each other forwards. Nature, 571(7766): S15−S17.
Sylos-Labini F, La Scaleia V, Cappellini G, et al. 2020. Distinct locomotor precursors in newborn babies. Proceedings of the National Academy of Sciences of the United States of America, 117(17): 9604−9612.
Takei T, Confais J, Tomatsu S, et al. 2017. Neural basis for hand muscle synergies in the primate spinal cord. Proceedings of the National Academy of Sciences of the United States of America, 114(32): 8643−8648.
Ting LH, Chiel HJ, Trumbower RD, et al. 2015. Neuromechanical principles underlying movement modularity and their implications for rehabilitation. Neuron, 86(1): 38−54.
Tresch MC, Bizzi E. 1999. Responses to spinal microstimulation in the chronically spinalized rat and their relationship to spinal systems activated by low threshold cutaneous stimulation. Experimental Brain Research, 129(3): 401−416.
Tresch MC, Saltiel P, Bizzi E. 1999. The construction of movement by the spinal cord. Nature Neuroscience, 2(2): 162−167.
Vogt N. 2018. Machine learning in neuroscience. Nature Methods, 15(1): 33.
Yaron A, Kowalski D, Yaguchi H, et al. 2020. Forelimb force direction and magnitude independently controlled by spinal modules in the macaque. Proceedings of the National Academy of Sciences, 117(44): 27655−27666.
Huang S, Guo X, Xie JJ, et al. Rectified Latent Variable Model-Based EMG Factorization of Inhibitory Muscle Synergy Components Related to Aging, Expertise and Force-Tempo Variations. Sensors (Basel), 2024, 24(9): 2820.
DOI:10.3390/s24092820
2.
Cheung VCK, Ha SCW, Zhang-Lea JH, et al. Motor patterns of patients with spinal muscular atrophy suggestive of sensory and corticospinal contributions to the development of locomotor muscle synergies. J Neurophysiol, 2024, 131(2): 338-359.
DOI:10.1152/jn.00513.2022
3.
Tang N, Zheng YT, Zhao H, et al. Jump further, leap higher, and consolidate stronger: A brief review of the long-term partnership between Kunming Institute of Zoology (KIZ) and the Chinese University of Hong Kong (CUHK) in bioresources and molecular research. Zool Res, 2023, 44(3): 556-558.
DOI:10.24272/j.issn.2095-8137.2023.091
Table
2.
Linear regression model correlating divergence values with stimulation intensity and stimulation location
Estimate
SE
tStat
P-value
(Intercept)
–0.13586
0.015139
–8.9744
4.366× {10}^{-18}
Location
0.15305
0.027565
5.5522
4.3735× {10}^{-8}
Stimulation intensity
0.04307
0.0095633
4.5037
8.1413× {10}^{-1}
Location-intensity interaction
−0.039897
0.018457
−2.1617
0.031071
Number of observations: 560, Error degrees of freedom: 556
Root mean squared error: 0.0906
R-squared: 0.132, Adjusted R-squared: 0.127
F-statistic vs. constant model: 28.1, P=6.16×10⁻¹⁷
Divergence was positively correlated with stimulation location (P<0.05) and with interaction between stimulation intensity and location, but it was not correlated with the stimulation intensity alone (P>0.05).


 DownLoad: